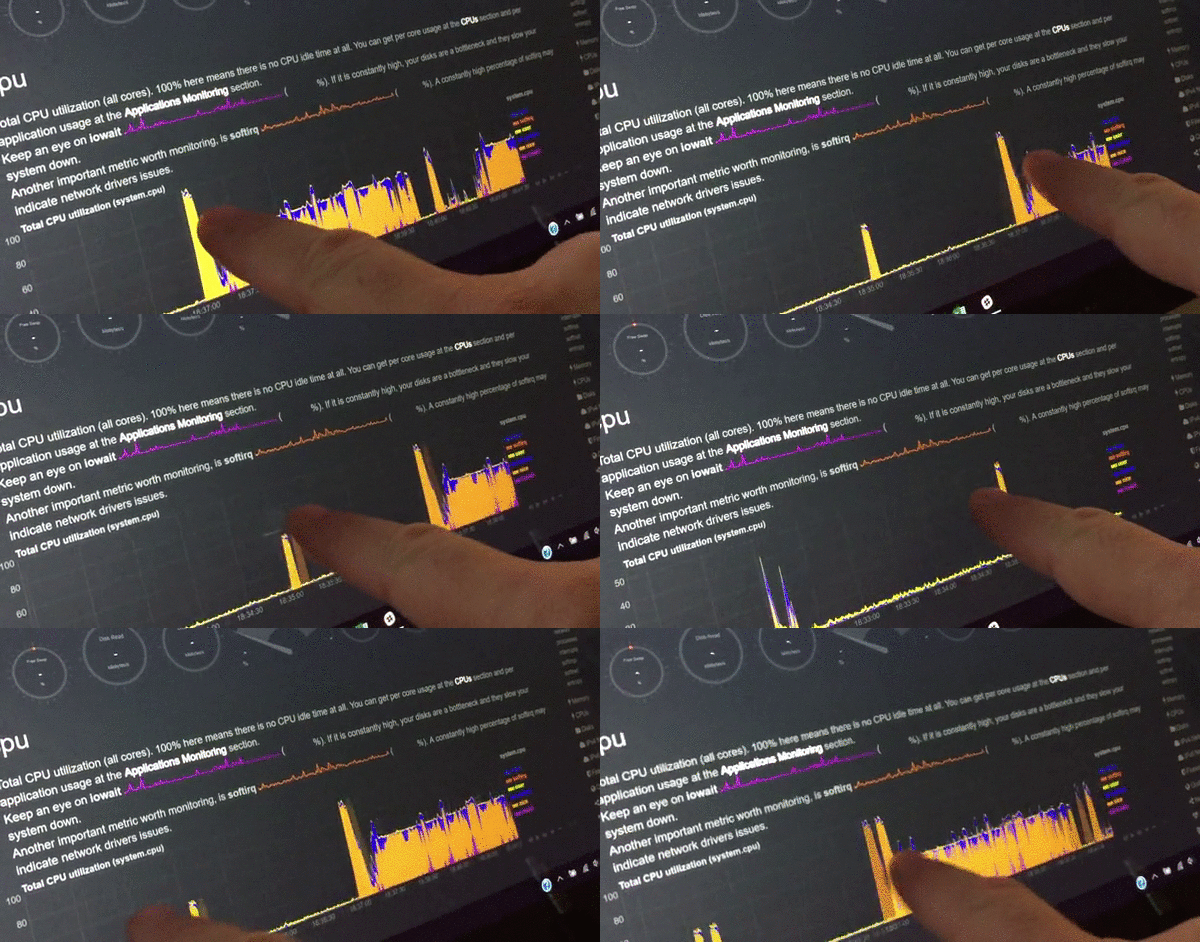
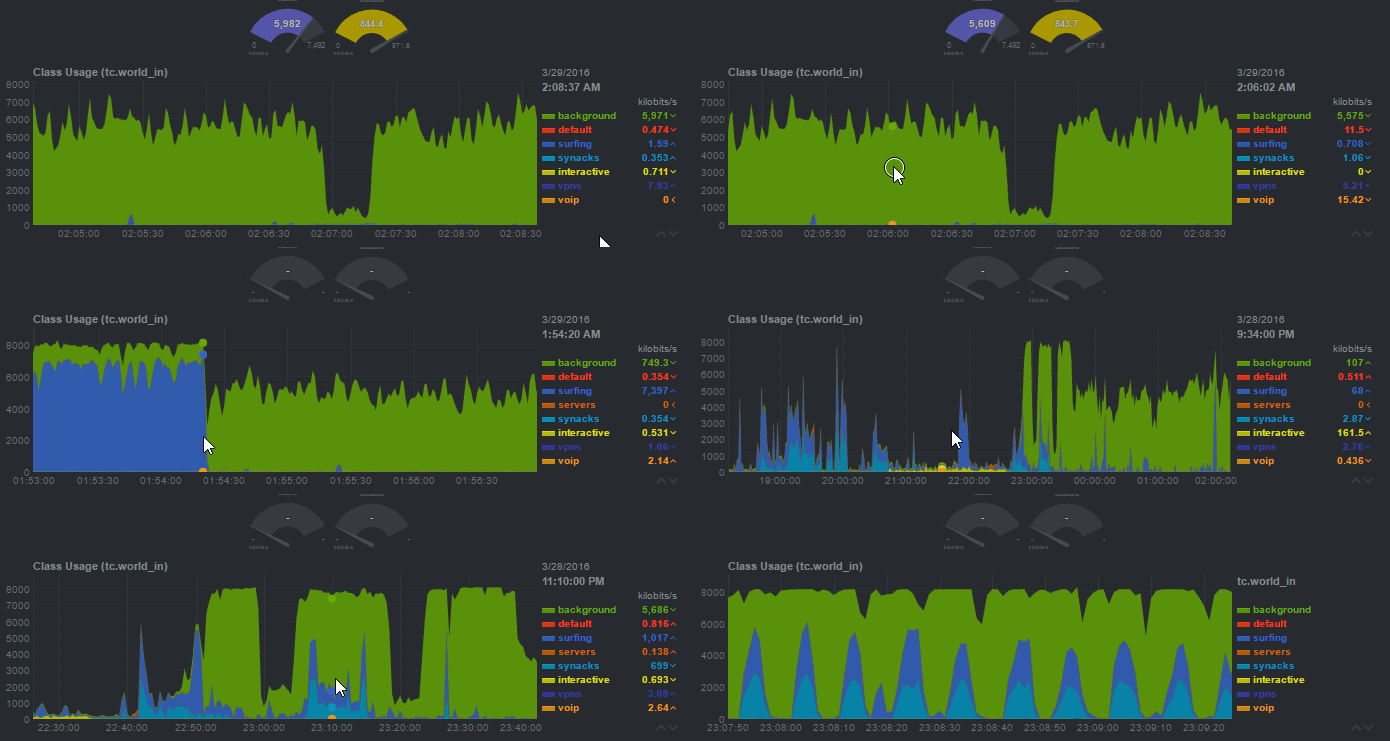
I like to keep a monitoring eye on my servers, as most people who manage servers do. I have one central server that monitors the others. I choose to use a central server, so the other ones don’t have to use any extra resources. But now I found a tool that can be run on every Linux based server with SNMP, that barely uses any resources. And it shows a shitload of real-time graphs. Since I like graphs, and stats, and figures, a lot, I decided to install it on a test server. I was surprised how much information it will show you. It’s an awesome tool in my opinion! It shows graphs about literally everything that is going on with your server. There’s several functioning demos that show what it can do and what it looks like. So go there and see for yourselves: http://my-netdata.io/#demosites

If you like what you saw on the demo pages and decided to try this out for yourself, here’s some really simple instructions that will only cost you five minutes of your time. Click the Read More link below to view the rest of this article.
First, we need to install some required software packages that are needed to run NetData. So from the console, depending on your flavor of Linux, enter:
On Ubuntu/Debian:sudo apt-get install zlib1g-dev gcc make git autoconf autogen automake pkg-config lm-sensors
On CentOS/RHEL:yum install zlib-devel gcc make git autoconf autogen automake pkgconfig libuuid-devel
On Fedora:dnf install zlib-devel libuuid-devel libmnl-devel gcc make git autoconf autoconf-archive autogen automake pkgconfig curl findutils
Now we download the most recent version directly from the GitHub in to your /opt folder and execute the installer because that will take care of the rest.
cd /optgit clone https://github.com/firehol/netdata.gitcd netdata./netdata-installer.sh
Press ENTER to build and install netdata to your system > The installation will only take a minute or two. If all went well, you will see the following
— We are done! —
^
|.-. .-. .-. .-. .-. . netdata .-. .-
| ‘-‘ ‘-‘ ‘-‘ ‘-‘ ‘-‘ is installed and running now! -‘ ‘-‘
+—-+—–+—–+—–+—–+—–+—–+—–+—–+—–+—–+—–+—>enjoy real-time performance and health monitoring…
Now it’s time to start monitoring! NetData can be started / stopped using these commands:
sudo systemctl start netdatasudo systemctl stop netdatasudo systemctl status netdata
If you are using a firewall you should open port 19999 (TCP) to allow access to the web interface. If you are using ufw like I do, all you need to type is:
sudo ufw allow 19999/tcpsudo ufw reload
The NetData tool should now be accessible through your web browser by entering the hostname or the IP address of the server and the portnumber 19999. For example http://servername:19999 or . During the installation a config file was created in /etc/netdata/netdata.conf that you could edit to your liking. It’s also accessible from your browser simply by visiting http://servername:19999/netdata.conf but that’s for viewing the config only. Editing can not be done from the browser you have to manually edit the /etc/netdata/netdata.conf file with your favorite editor. Whenever you want to update the software use these commands:
cd /opt/netdatagit pull./netdata-installer.sh
If for some reason you don’t like this great tool anymore, and want to remove NetData from your server you can uninstall it easy like this:
cd /opt/netdata./netdata-uninstaller.sh
If these instructions somehow didn’t work for you, you should take a look at the wiki page on the github because there are several ways to install NetData especially for other flavors of linux. Have fun looking at those neat graphs, and please give the project / authors a star on GitHub because it is well deserved!

